AUD/JPY, AUD/NZD, USD/ZAR:
Bullish Momentum Builds Across Key Crosses

Tafara Tsoka
Chief Executive Officer: Zion Venture Partners
August 1, 2025
Source: Investing.com
AUD/JPY
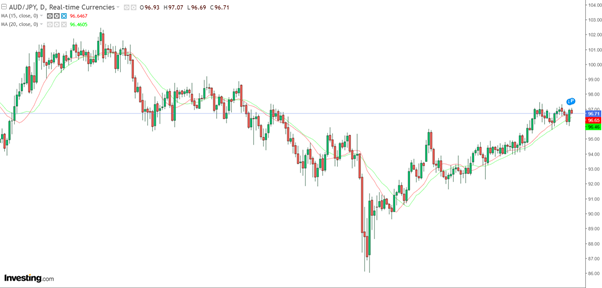
AUD/JPY is currently trading at 96.724, continuing a strong upward trajectory that began in mid-April following a sharp recovery from the 86.50 lows. The pair has been consistently trading above both the 15-day and 20-day Simple Moving Averages (SMAs), which are sloping upward and confirming sustained bullish momentum.
The recent price action shows a successful breakout above the previous resistance level at 96.00, now acting as a support zone. The structure suggests the formation of a bullish trend channel with higher highs and higher lows, supported by consistent buying pressure.
Key Levels
- Immediate Resistance: 97.50 (psychological level and short-term extension target)
- Major Resistance: 98.80 (February swing high)
- Immediate Support: 96.00 (former resistance turned support)
- Trend Support: 94.70 (aligned with rising SMAs)
Bias: Bullish
As long as price holds above 96.00, the outlook remains constructive. A daily close above 97.50 could accelerate the rally toward the 98.80 resistance zone. A breakdown below the SMAs may signal consolidation or a minor correction but would not invalidate the broader uptrend unless price falls below 94.00.
Momentum favours the bulls, with trend-following strategies likely to perform well in this structure.

AUD/CHF
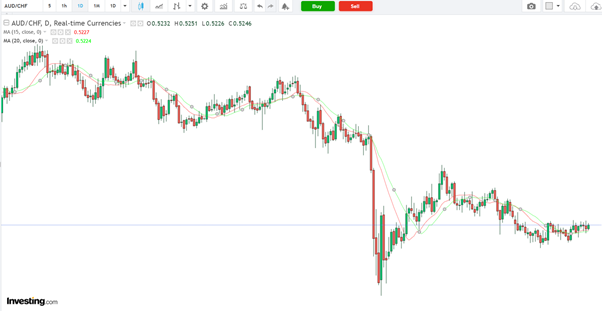
AUD/CHF is trading at 0.52457, showing early signs of recovery after a prolonged downtrend that bottomed near 0.5050 in April. The pair has since stabilized and is gradually climbing, forming a mild upward channel from mid-July. The 15-day and 20-day Simple Moving Averages are converging and turning upward, indicating a potential shift in momentum.
Currently, price is trading slightly above both SMAs, which suggests a neutral-to-bullish bias in the short term. However, sustained momentum above 0.5300 is required to confirm a stronger bullish reversal.
Key levels
- Immediate Resistance: 0.5300
- Next Resistance: 0.5440
- Support Zone: 0.5170 – 0.5140
- Breakout Support: 0.5050 (April low)
Bias: Neutral to slightly bullish
A confirmed break above 0.5300 would open up upside potential toward 0.5440, while failure to hold above 0.5170 could see price retesting the 0.5050 lows.
Momentum is building, but confirmation from volume and price action is needed to validate any sustained recovery.

AUD/NZD
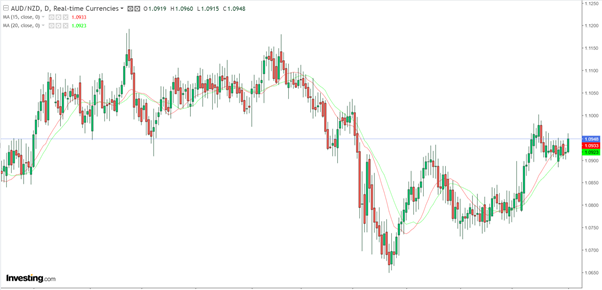
AUD/NZD is currently trading at 1.1046, building bullish momentum after a breakout above the key horizontal resistance at 1.0950. This level had acted as a major pivot zone since early March, capping price rallies and acting as support before the April decline. The recent breakout is supported by strong upward movement from mid-June lows around 1.0710, indicating a reversal structure with higher highs and higher lows.
Both the 15-day and 20-day Simple Moving Averages are now sloping upward and price is well above them, confirming bullish sentiment in the short to medium term.
Key Levels
- Immediate Resistance: 1.1100
- Major Resistance: 1.1163 (January swing high)
- Breakout Support: 1.0950
- Trend Support: 1.0875
Bias: Bullish
Sustained trading above 1.0950 strengthens the bullish case, targeting 1.1100 and potentially 1.1160 in the coming sessions. However, a break back below 1.0950 may invalidate the breakout and see a pullback to the 1.0875–1.0800 zone.
Momentum remains positive, supported by trend-following signals and solid price structure. Confirmation from volume or a retest of 1.0950 as support would further validate the breakout.

USD/ZAR
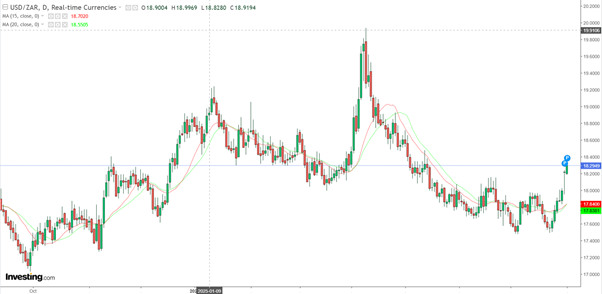
USD/ZAR is trading at 18.1279, showing a strong rebound from July lows near 17.20, with price currently challenging a key horizontal resistance around 18.28. This level served as critical support in Q1 2025 and is now acting as a major pivot zone. The recent breakout above the 15-day and 20-day SMAs confirms a short-term trend reversal from bearish to bullish momentum.
The steep rally in the last few sessions is supported by strong bullish candles and an uptick in short-term momentum, suggesting possible continuation—though the pair is approaching a critical inflection zone.
Key Levels
- Immediate Resistance: 18.28 (current breakout level)
- Next Resistance: 18.68
- Support: 17.70 (former range resistance)
- Trend Support: 17.20 (July low
Bias: Bullish breakout in progress
A daily close above 18.28 would confirm a bullish breakout, with upside potential toward 18.68, and possibly 19.10. However, failure to sustain above this level may result in a retest of 17.70, especially if bullish momentum fades.
Overall, momentum is strong, and technical signals point to further upside – provided the breakout holds and macro sentiment continues to support USD strength.

